SEATTLE DEPARTMENT OF TRANSPORTATION

2024 - 2025

Improving the Public Transportation Safety Experience

Project Timeline

Tools

Impact

Impact

My role

July 2024 - Present

Facilitating Research Partnerships

UX Researcher

Instructional Design
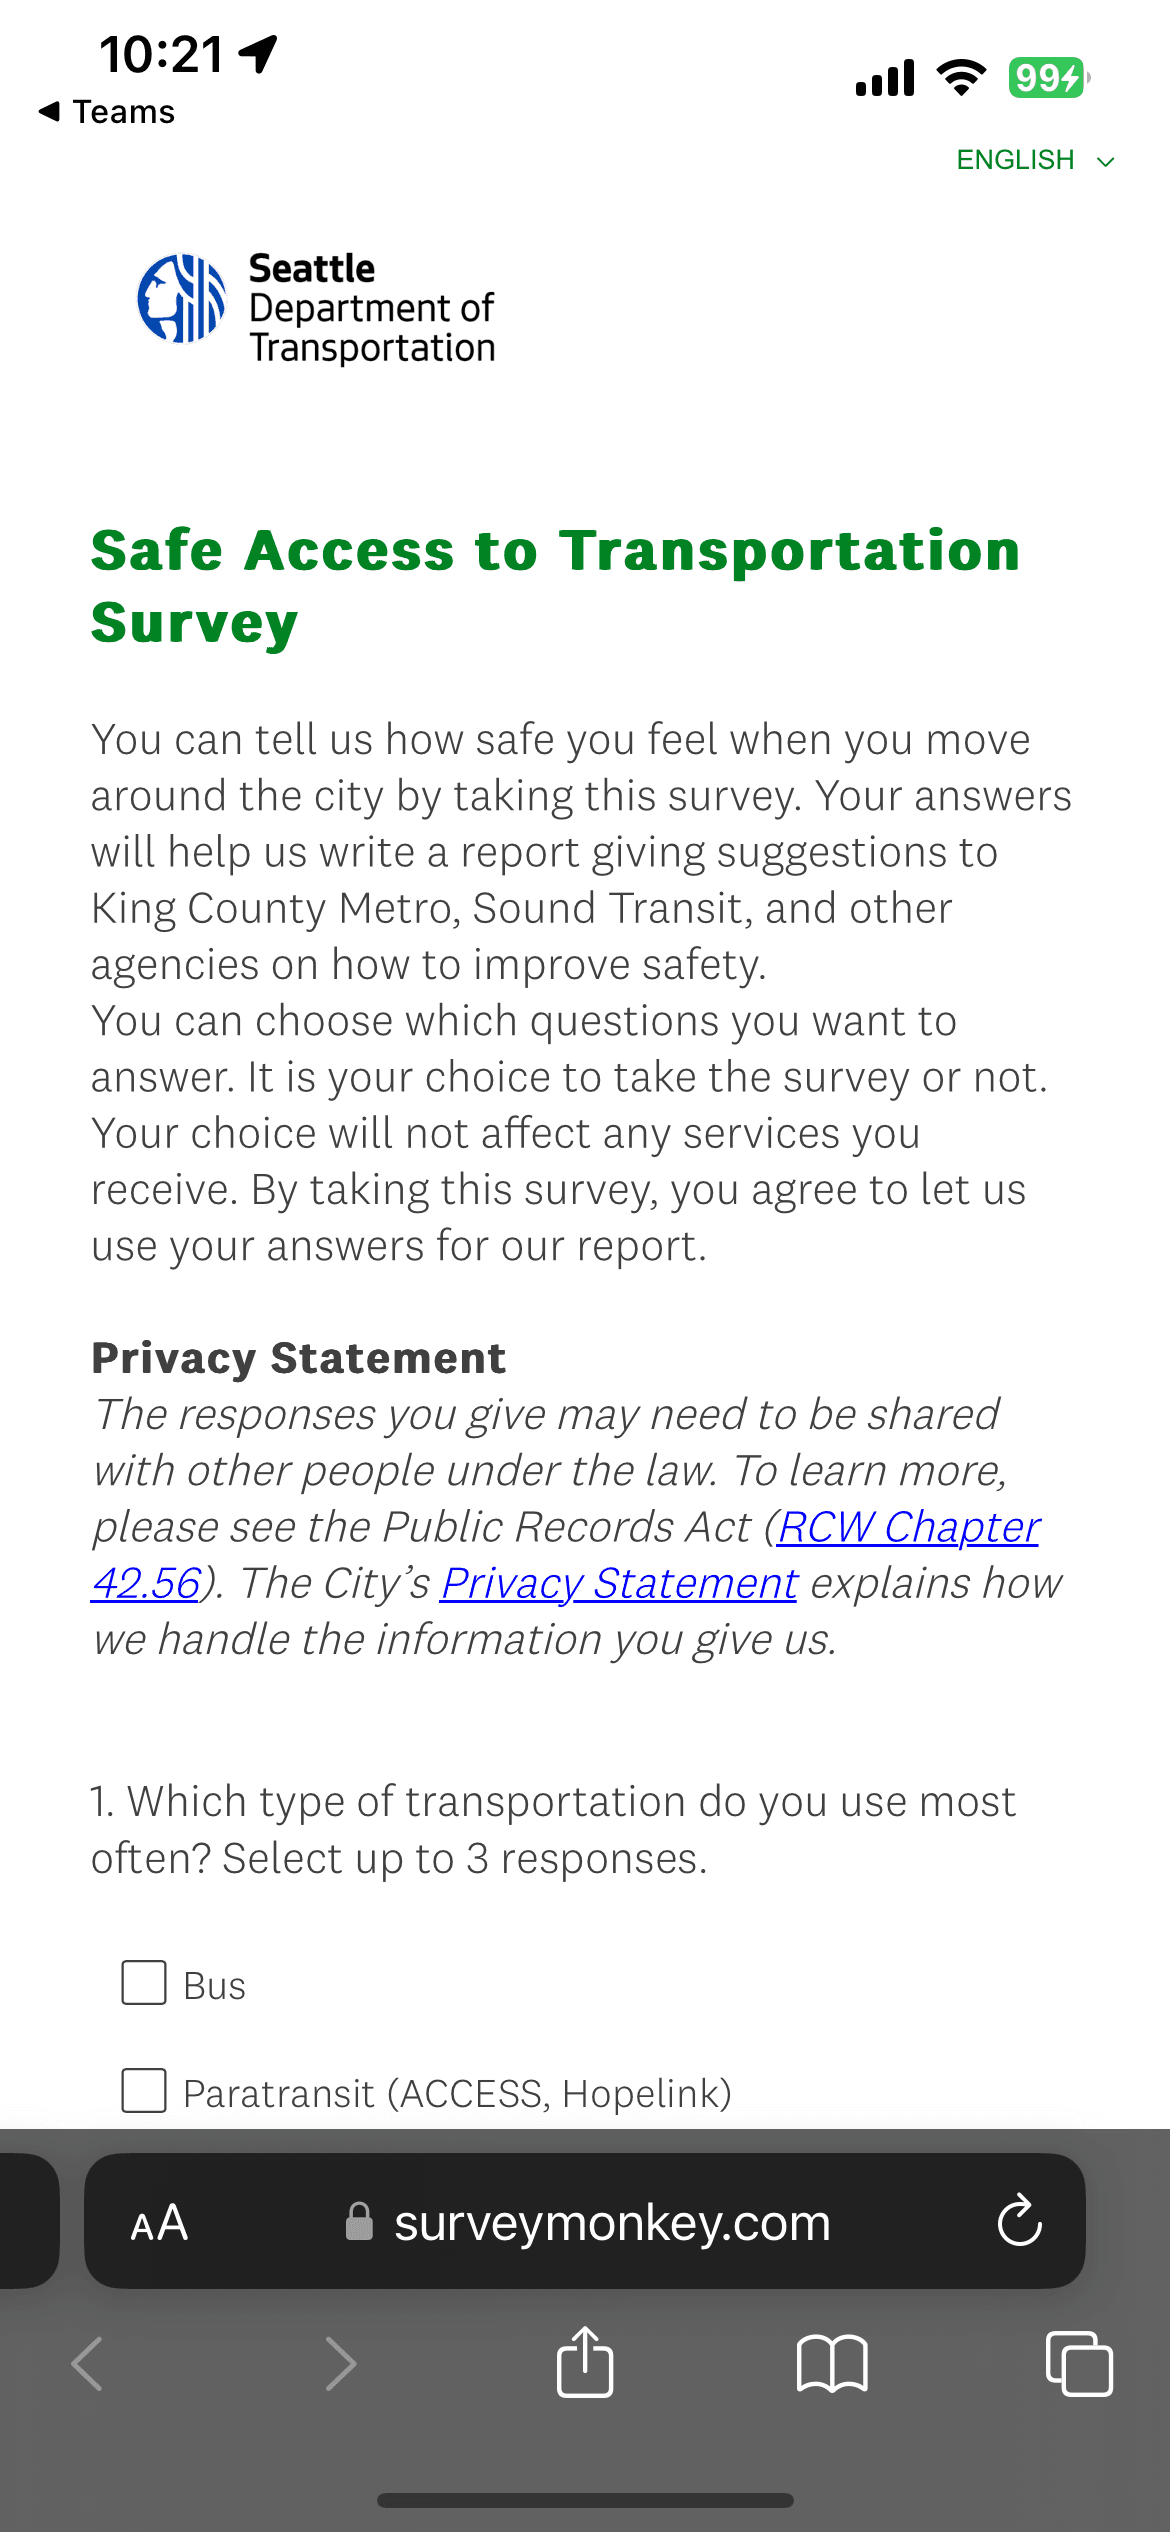


SurveyMonkey

Excel

Tableau

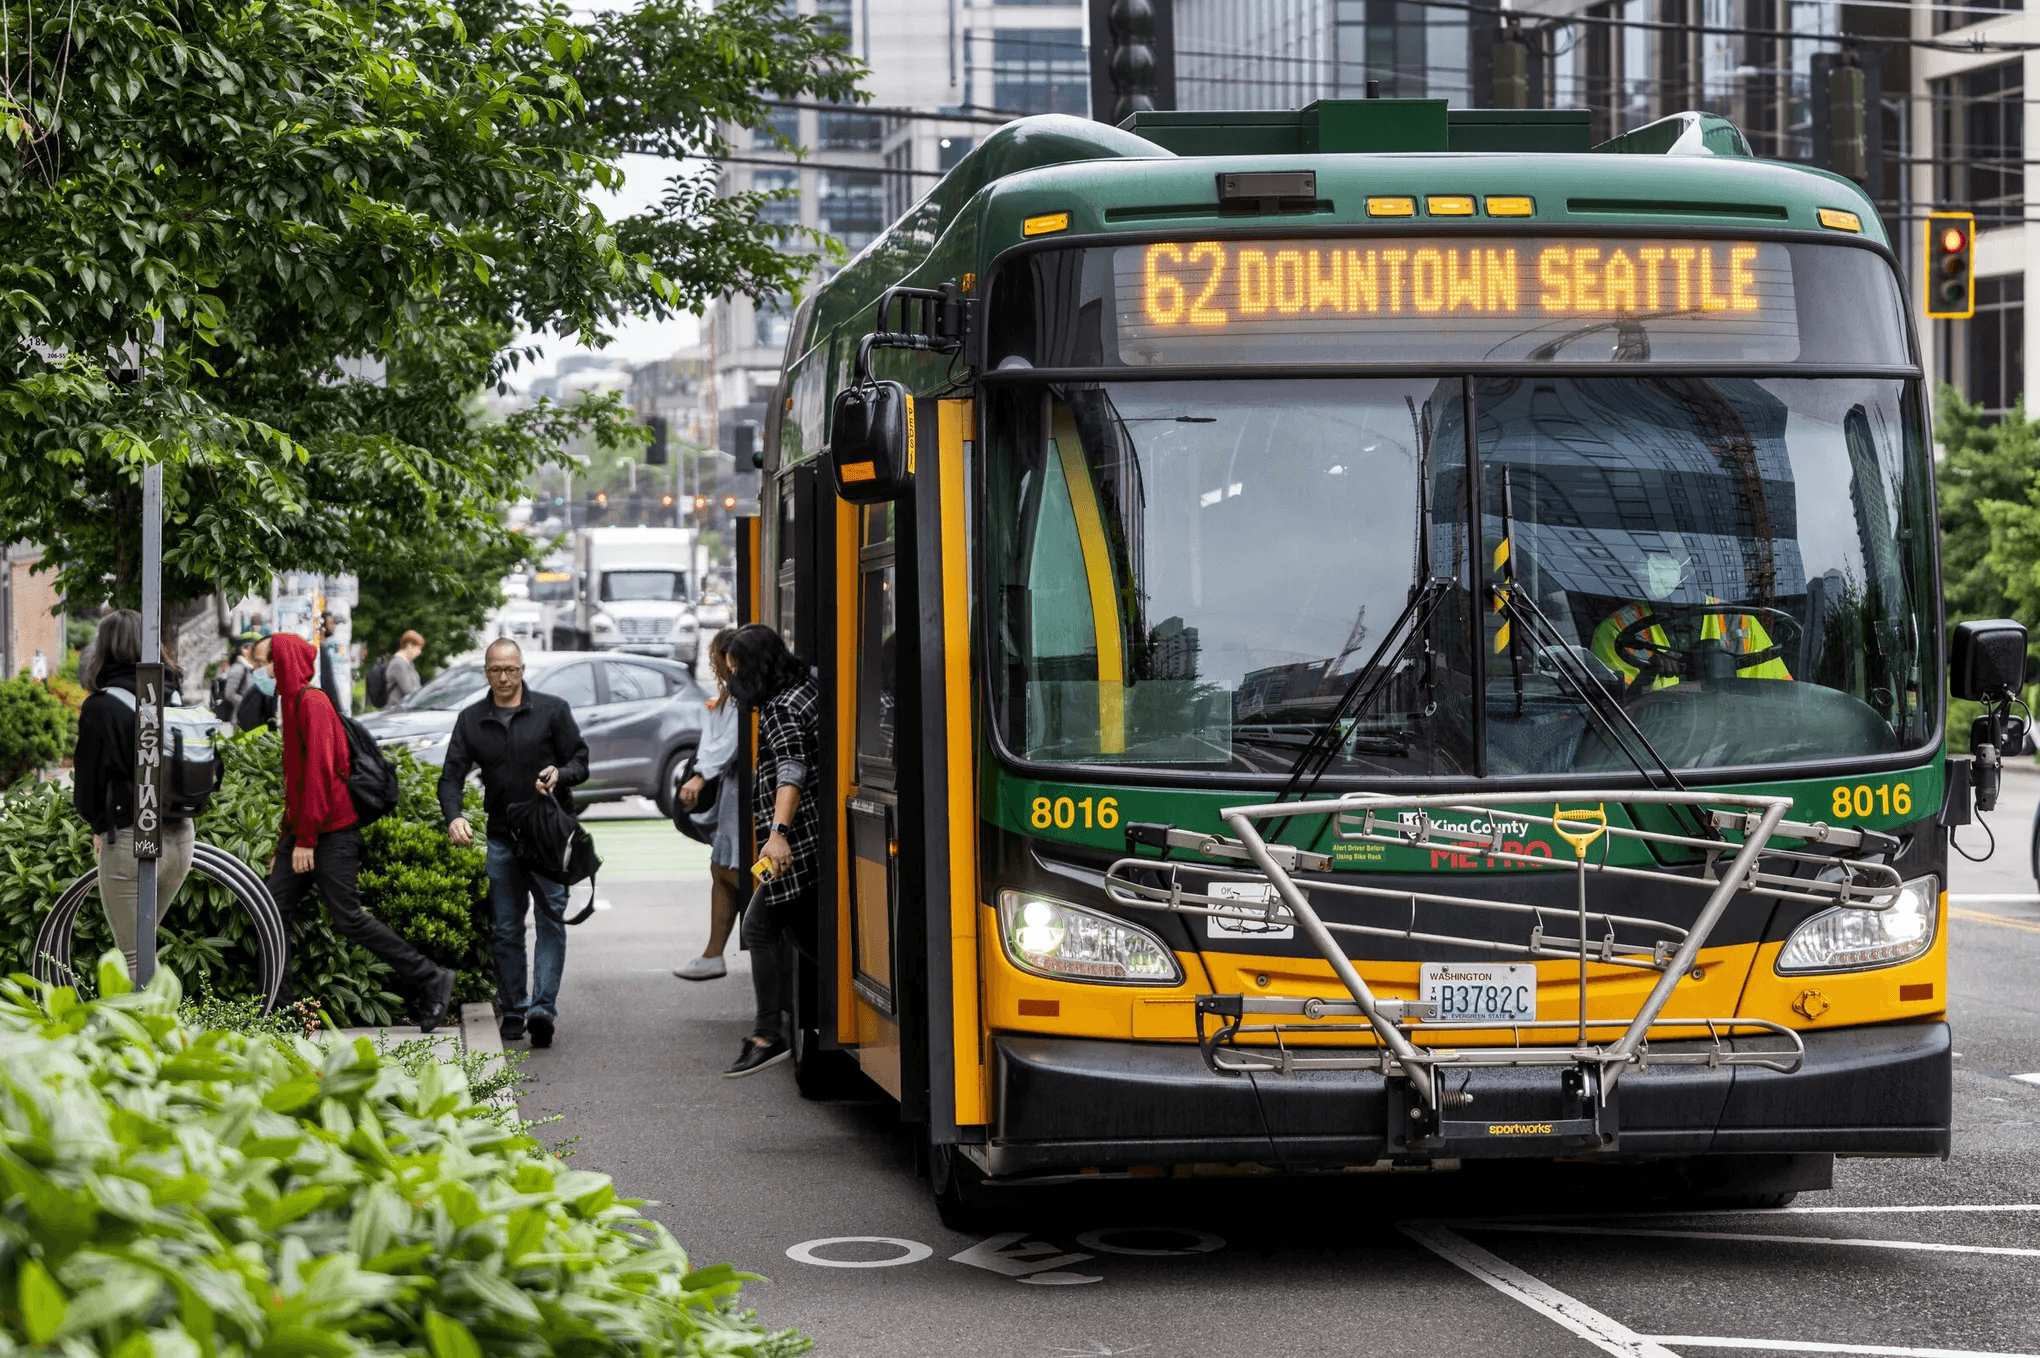
Making recommendations to improve public transit safety for 400k riders in Seattle.

The Transportation Access Program (TAP) at the Seattle Department of Transportation is committed to advancing transportation equity and safety across Seattle. Studies conducted by King County Metro and Sound Transit have identified safety as a major barrier to accessing public transportation. However, much of this research focuses on reported incidents or general rider sentiment, leaving significant gaps in understanding how safety is experienced by the city’s most vulnerable transit users.

The Transportation Access Program (TAP) at the Seattle Department of Transportation is committed to transportation equity and safety. Across many studies conducted by King County Metro and Sound Transit - safety has been identified as a huge barrier to transportation access. However, there are significant gaps in research surrounding people's experiences with safety and transportation especially when it comes to vulnerable riders.


Research from Vision Zero highlights that housing insecure populations are significantly more likely to experience transit-related fatalities. Yet, there's currently no research that shows what contributes to feelings of safety or lack of safety for this population when it comes to public transportation. Considering principles of universal design, when we address concerns for the most vulnerable populations, we automatically improve outcomes for everyone else.


The goal of this research project was to understand barriers to safety for vulnerable riders and make design recommendations to SDOT leadership.


OVERVIEW

THE RESEARCH GAP

CONSTRAINTS

This research operated within significant ethical, logistical, and institutional constraints. Participants were individuals experiencing housing instability — a population that may face heightened vulnerability, trauma exposure, and distrust of government systems.


To address these constraints, we took a participatory research approach. I facilitated partnerships with 6 community based organizations (CBOs) that work with this population. The study was designed to collect no identifying information, requiring careful consideration of consent language, data storage, and question framing. Additionally, varying literacy levels, inconsistent digital access, and unpredictable schedules influenced research design and distribution strategy, necessitating plain-language surveys, paper options, and flexible participation formats.

Data from Vision Zero indicates that people experiencing housing insecurity are disproportionately impacted by traffic-related injuries and fatalities. Yet there's little research examining what shapes perceptions of safety or lack of safety among transit riders experiencing housing instability, and how those perceptions influence mobility decisions.


Perceived safety directly affects behavior: riders may alter their routes, change travel times, avoid certain stops, or forgo trips entirely. For people already facing housing instability, these changes can further restrict access to employment, services, and community resources. Guided by principles of universal design, we wanted to understand perceptions of safety for this population because that would hold the potential to impact safety outcomes for everyone.


How might we understand perceptions of transportation safety among transit riders experiencing housing instability in a way that is anonymous, trauma-informed, and actionable for the Seattle Department of Transportation?


Our Research Partners

Our research partners included Mary's Place, Urban League of Metropolitan Seattle, DESC, Compass Housing Alliance, the doorway project, and Youth Care. Research partners were also compensated for their time throughout the project.


Our partners were involved in our research strategy from the beginning. This ensured that our approach was ethically sound and sensitive to the experiences of our target population.


We chose to recruit through our trusted community-based organizations to reduce power imbalance and increase psychological safety for research participants.

RESEARCH TIMELINE

GOALS AND METHODS

2

Phase 1 (October 2024 - December 2024) - Building Community Partnerships

I facilitated research partnerships with 6 community organizations. This entailed writing a one-pager explaining the project, the terms of the partnership, and compensation. I met one-on-one with several CBO representatives throughout this time to establish community relationships.


Phase 2 (January 2025 - March 2025) - Co-Developing Research Strategy and Framework

I set up and co-led bi-weekly meetings with our partners to develop the research strategy and framework. During this phase, we began drafting research methods for qualitative and quantitative research techniques. Simultaneously, I began designing a digital training to present to our community partners on best practices for conducting user research.


Phase 3 (April 2025 - July 2025) - Preparing Research Tools

We gathered feedback on our research documents (survey, interview, focus group questions) from our partners and plain-language access experts at SDOT. We piloted our survey and officially kicked off the implementation of the research across our partner agencies.


Phase 3 (July 2025 - September 2025) - Data Collection

Data collection stage. We distributed paper surveys and compensation.


Our team deeply valued


To understand transit safety experiences among vulnerable riders in Seattle, we partnered with community-based organizations serving marginalized populations. These partnerships were essential in shaping the research design, from identifying key concerns to co-developing survey tools, ensuring the process was grounded in the lived realities of those most impacted. Together, we collaborated on a mixed-methods research approach.

RESEARCH GOALS

GOALS AND METHODS

1

1

2

2

Identify specific factors that make public transit access, transit infrastructure, and right of way feel unsafe for vulnerable riders.

Identify traffic safety concerns that create challenges for vulnerable riders.

Understand travel patterns and destinations for riders.

3

3

4

4

Create an inclusive definition of safety that can serve as a foundation to improve transportation safety in Seattle.

RESEARCH FRAMEWORK

GOALS AND METHODS

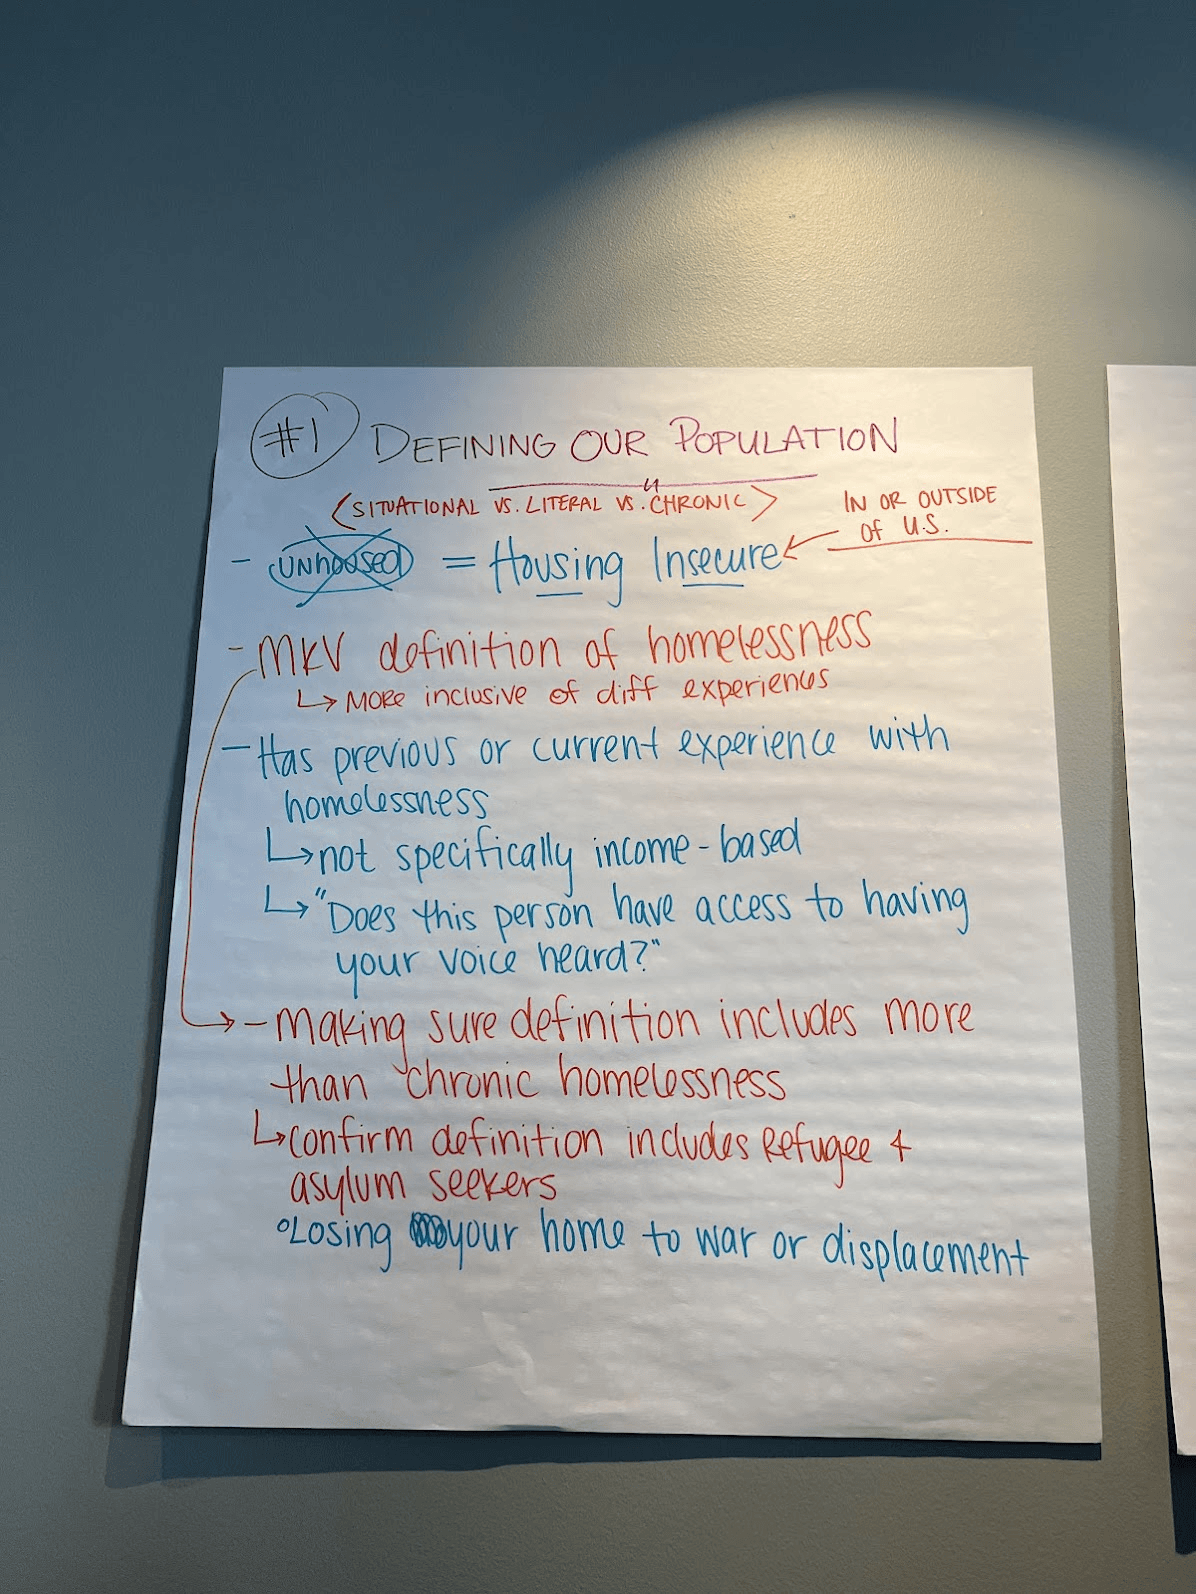
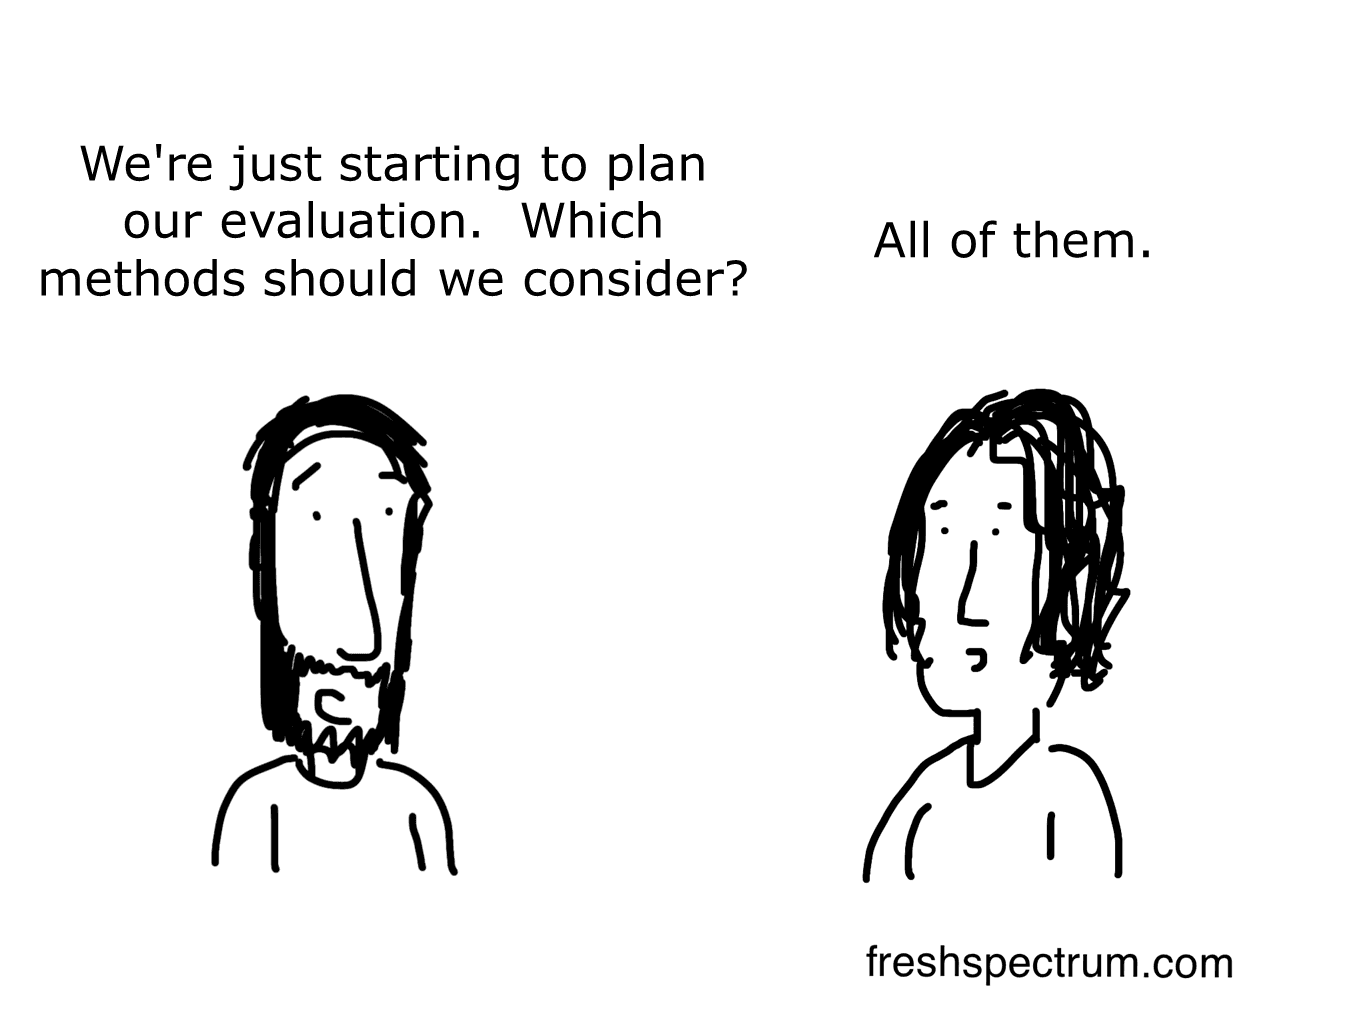
We had many questions we needed to address as a research team: How do we define safety? How do we define unhoused? Who do we want to include in our research study? How will we recruit participants? What is an appropriate way to provide compensation? What is a realistic timeline for carrying out this research? How will we carry out this research?


Once our community partnerships were established, we hosted a meeting with our partners to brainstorm and co-define research goals and methodology. We had 15 community representatives attend this meeting.

Housing Insecure: We landed on "housing insecure" as a way to describe experiences of housing instability with dignity. Housing insecure included folks with any experiences of housing instability, couch surfing, temporary housing in shelters, etc. This was important because we wanted to ensure our research was inclusive of people with varying experiences of housing insecurity.


Safety: We defined safety as physical and psychological safety in relation to accessing public transportation. We iterated on this definition throughout the research process to include emotional safety as well.

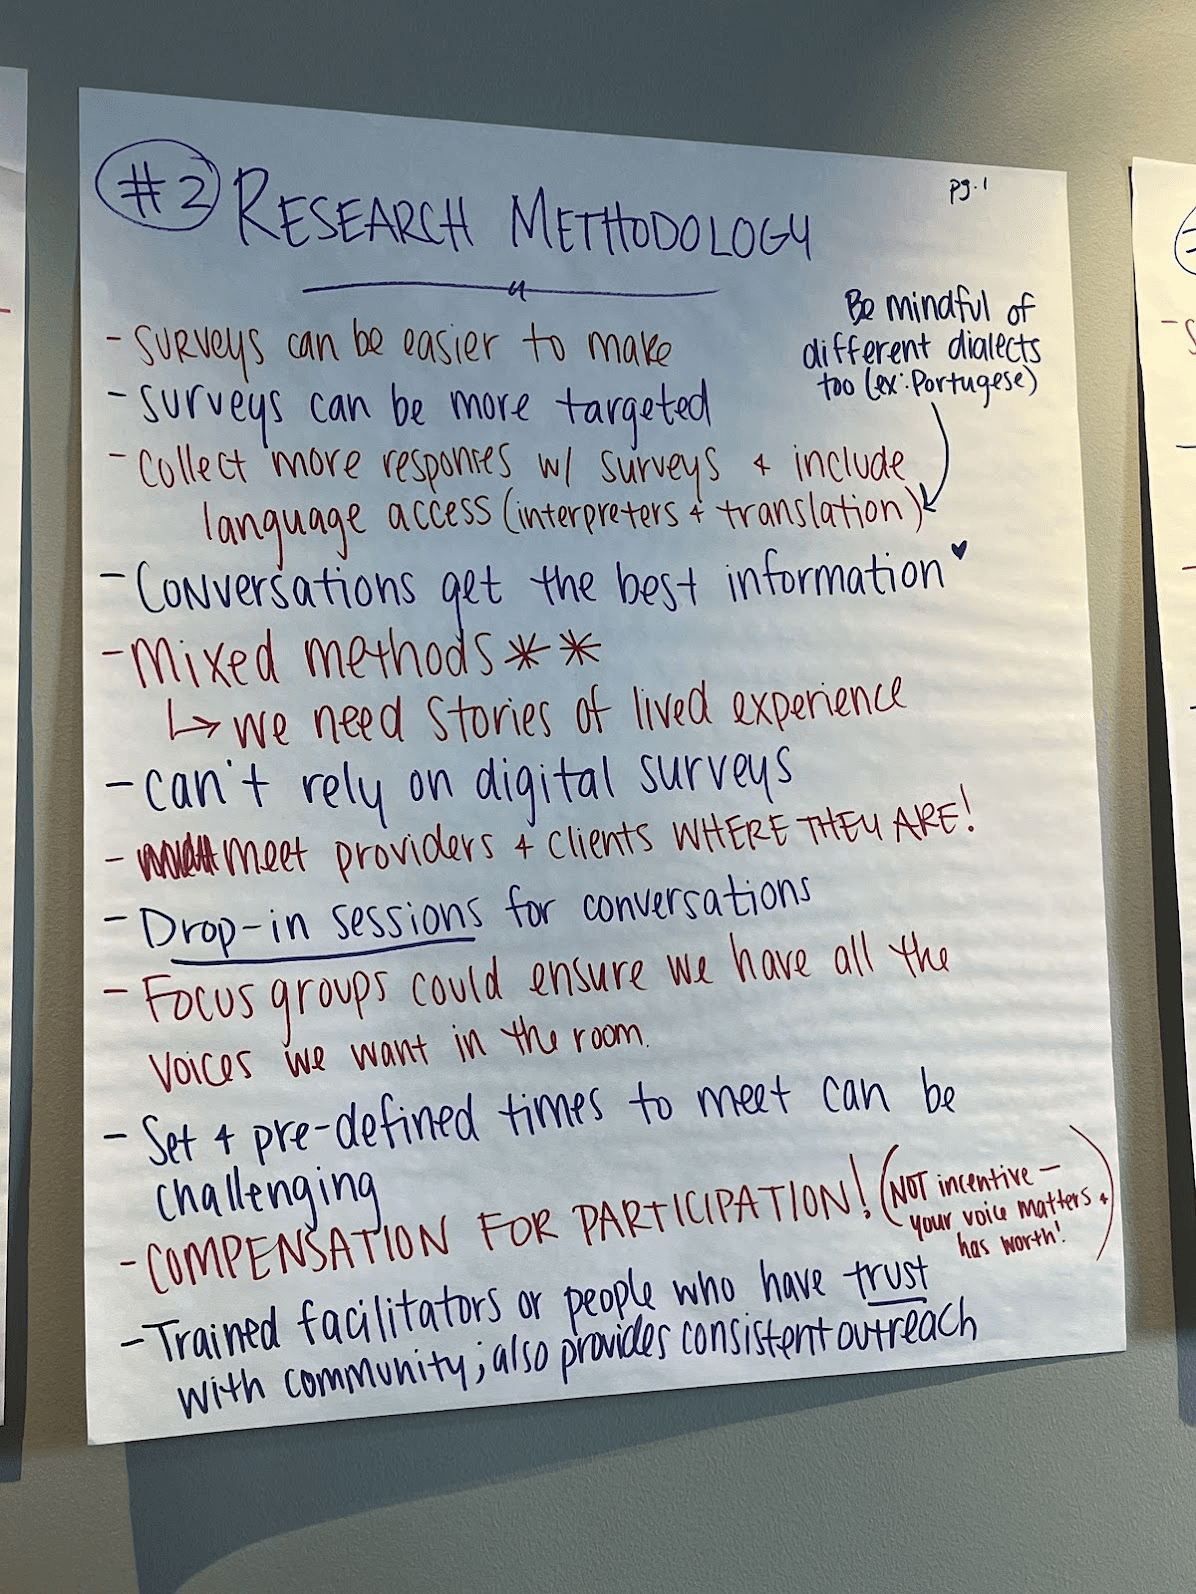
It was clear early on in our brainstorming discussions that we wanted to capture stories of lived experience. Ideally, the research methodology would center qualitative data collection first to best capture people's lived experiences with transportation safety. Based on qualitative insights, a survey could then be designed to dig deeper.


However, there were many considerations:


  • The implementation of this research would largely be done through the CBOs to reduce power imbalances and promote safety for research participants. CBOs are significantly understaffed and might not all have the capacity to host interviews, focus groups, or discussions. So, flexibility in the research instrument was necessary.


  • Timeline challenges: Because of SDOT funding and budgeting timelines, we were limited to a shorter time frame for data collection, analysis, and recommendations. Would we have enough time to lead qualitative research, analyze the data, and then design and implement surveys with our partners? Likely not. Therefore, we had to define both qualitative and quantitative research tools simultaneously in a way that gathered the most research insights and allowed room for new discoveries.


Our approach thus included both qualitative and quantitative data collection methods within the same timeline. Since our CBO partners would be implementing the research with us, we gave them options between survey distribution, user interviews during regular case management, and focus groups or discussions.

  • Current or past lived experience of housing insecurity

  • Lives, works, or plays in Seattle

  • Rides public transportation


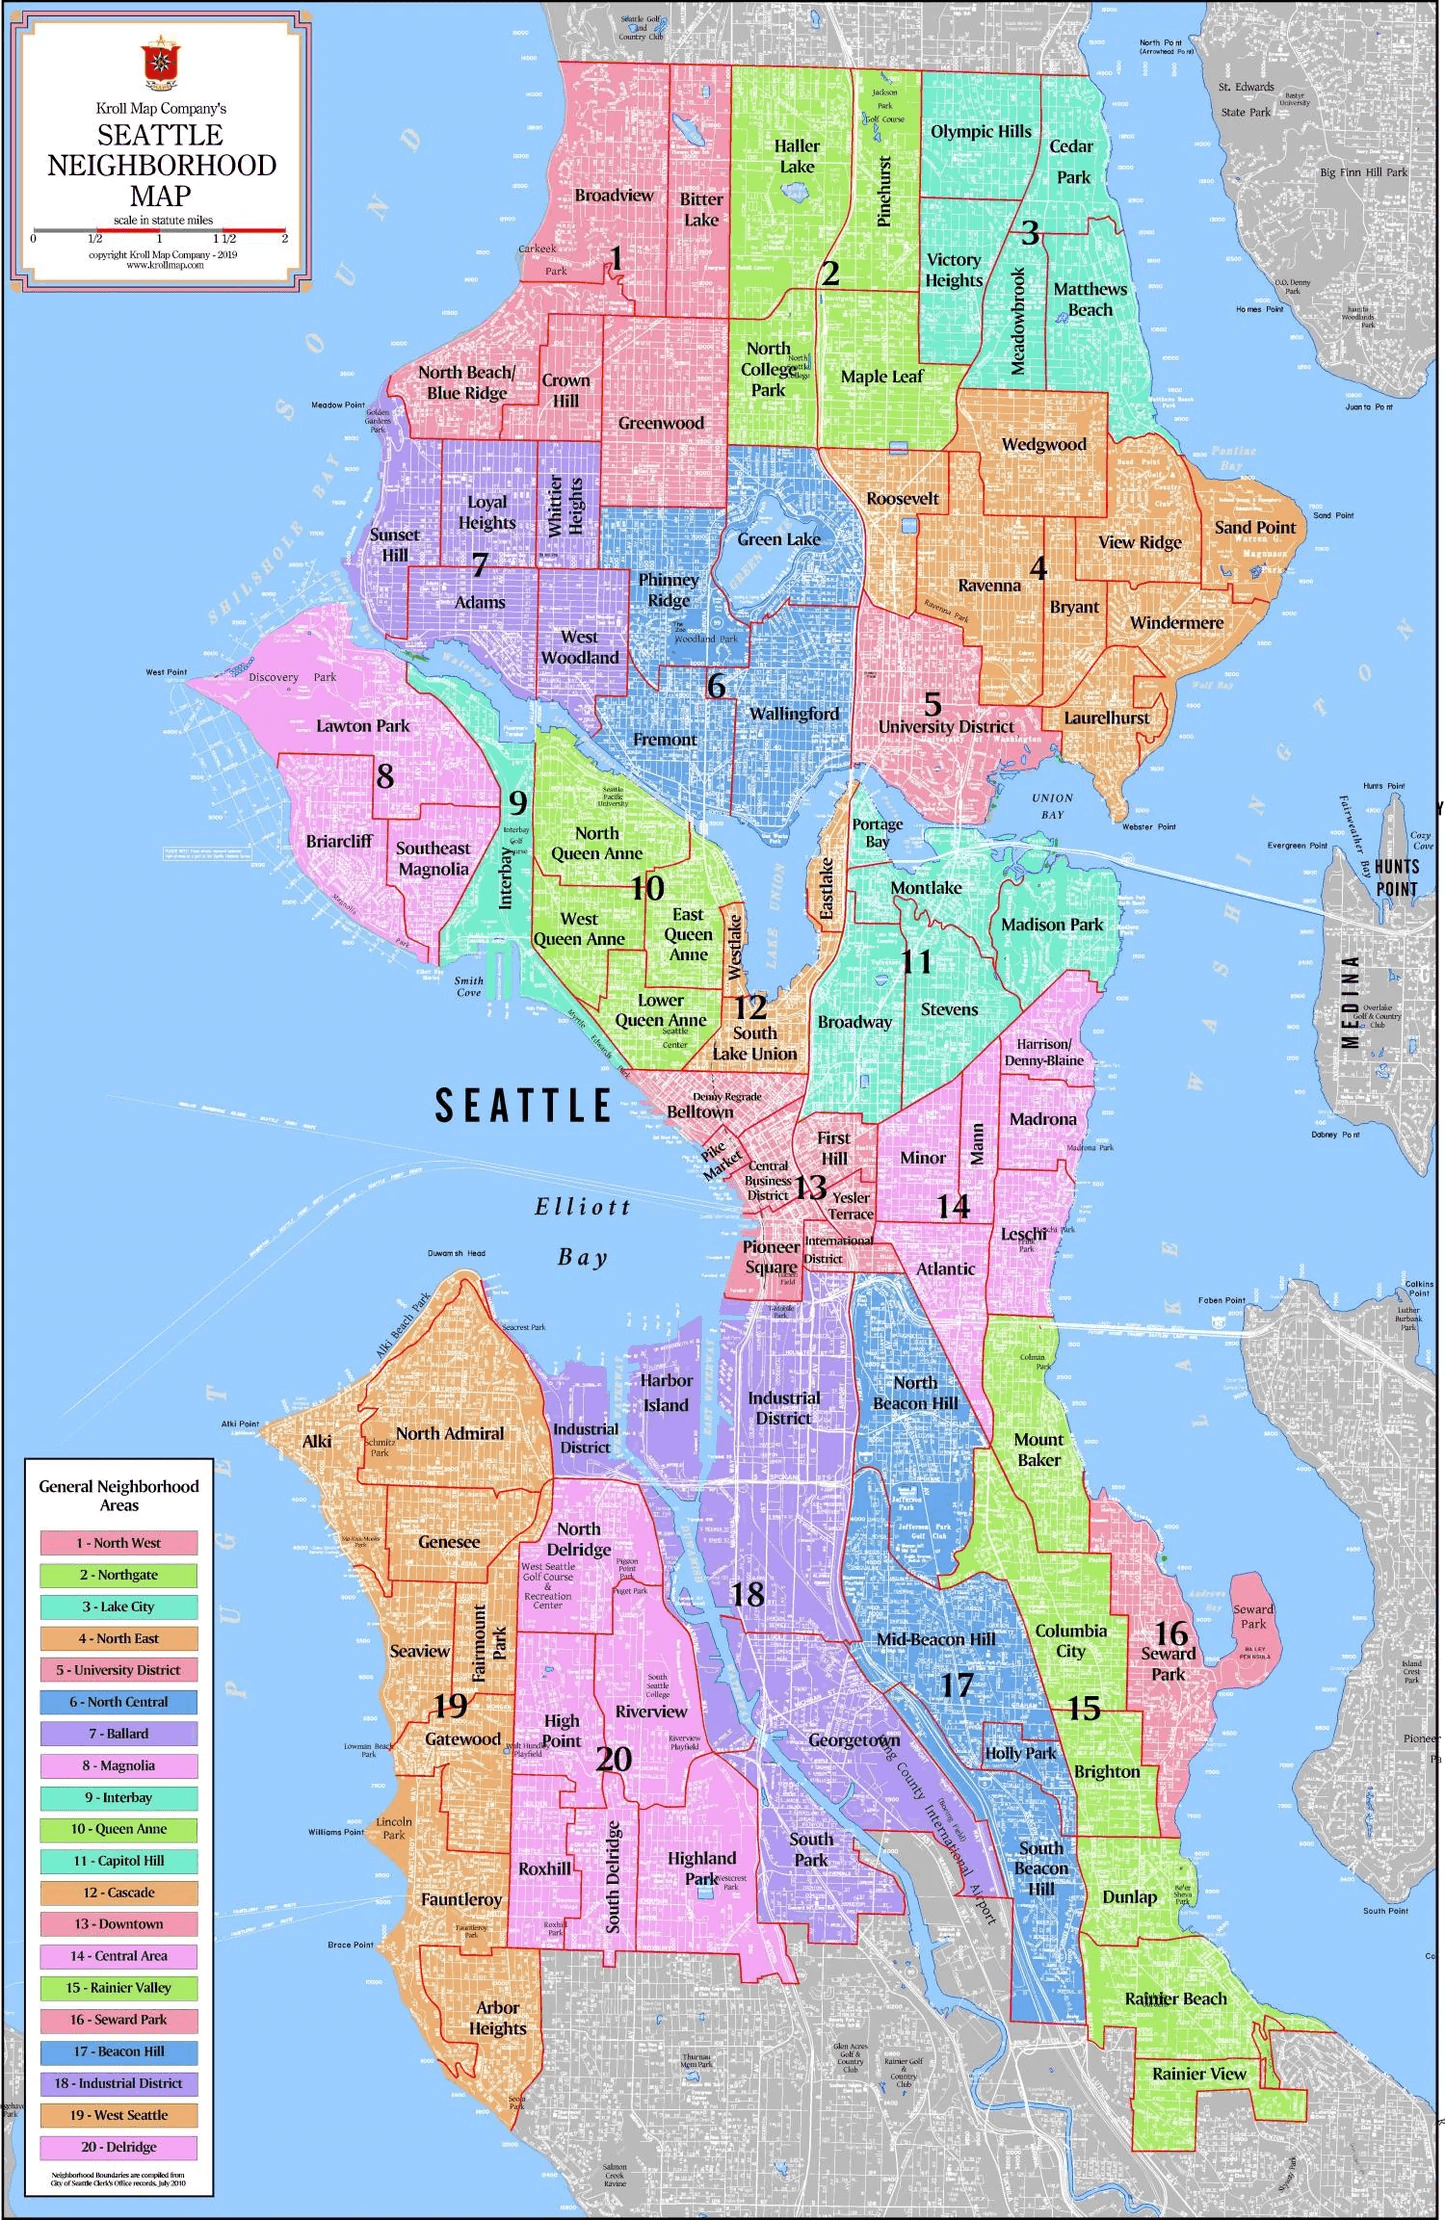
Our research participant criteria was intentionally broad because transit ridership in Seattle includes people from all backgrounds, ages, and demographics. This also meant that we had to aim for a large sample size spanning across different neighborhoods in Seattle to ensure that we weren't missing anyone. This informed our data collection goals and strategies significantly (more on that later).


All research participants received a fanny pack with a loaded orca card, socks, chapstick, sanitizer, and flashlight. These were all items that our community partners emphasized were of high demand for this population.

Collectively, we decided on a few definitions…

Mixed-Methods Approach

Recruitment Criteria and Considerations

Our first meeting with our partners was particularly insightful. We collectively developed our research methodology, defined our population, identified a research timeline, and brainstormed key research questions.

2

2

User Interview Questions

The Survey

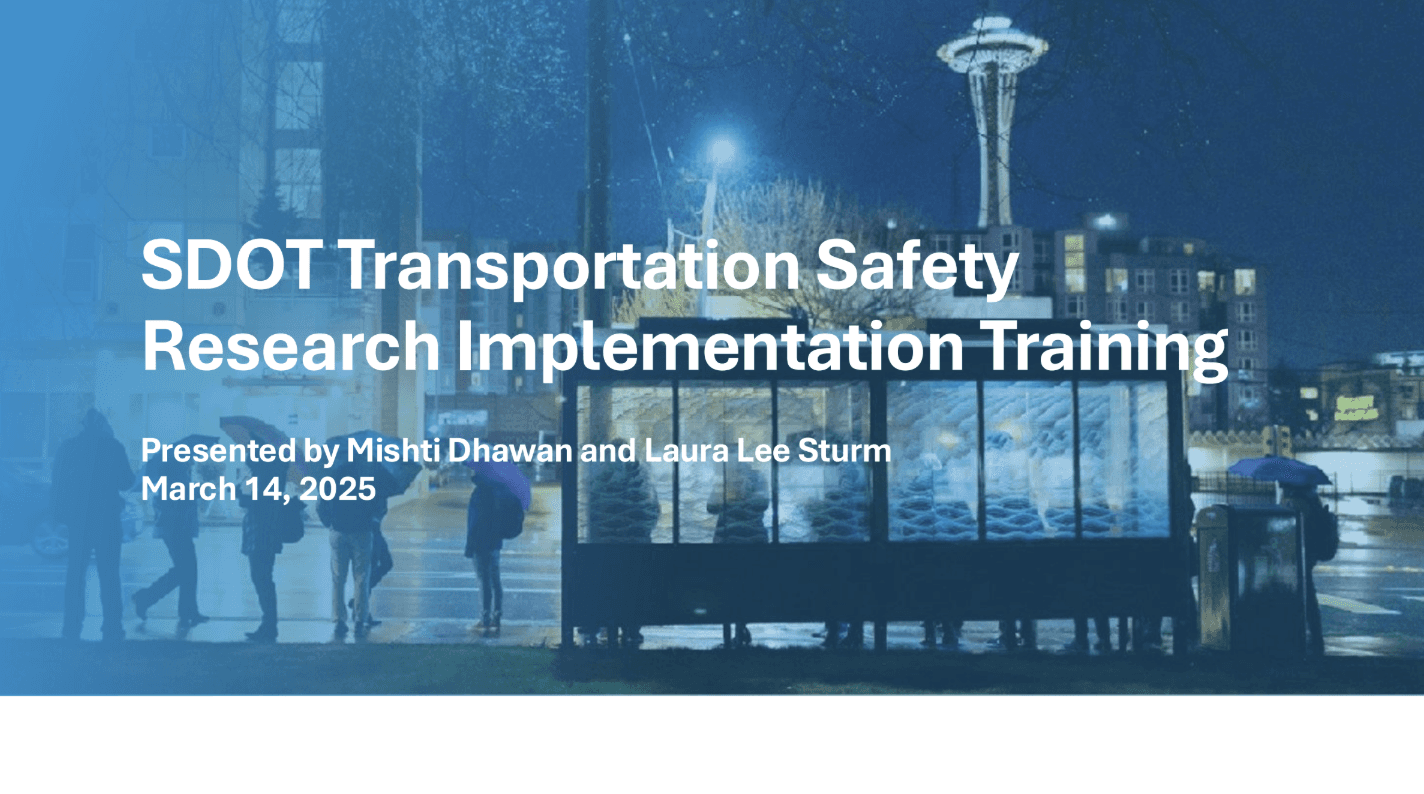
Research Implementation Training

QUALITATIVE VS QUANTITATIVE RESEARCH DESIGN

GOALS AND METHODS

After defining our research goals, we began to draft our research questions for both qualitative and quantitative data collection. The survey was designed to identify key transit patterns and common barriers at scale, while interviews/focus groups/discussion questions were designed to seek deeper insight into how safety concerns, infrastructure gaps, and social treatment shaped daily travel decisions.


After defining our research goals, we began to draft our research questions for both qualitative and quantitative data collection. The survey was designed to identify key transit patterns and common barriers at scale, while interviews/focus groups/discussion questions were designed to seek deeper insight into how safety concerns, infrastructure gaps, and social treatment shaped daily travel decisions.


In drafting our research questions, I made sure that there was no identifying information collected. Furthermore, all documents were reviewed by an SDOT plain-language expert to make sure that they were accessible and could be translated across 19 different languages.


In drafting our research questions, I made sure that there was no identifying information collected. Furthermore, all research questions were reviewed by an SDOT plain-language expert to make sure that they were accessible and could be translated across 19 different languages.


  1. How regularly do you use public transportation?

  2. Tell me about the places you go to regularly (for example, key services, appointments, or visiting people)?

  3. How do you usually get to those places?

  4. Can you walk me through the last time you took public transportation to [frequent destination]?

  5. What has your experience been like using sidewalks? What about public transit?

  6. What makes you feel uncomfortable or unsafe when you're outside?

  7. Can you tell me about a time you felt unsafe while taking public transportation?

  8. Have you ever felt treated differently while walking, waiting for transit, or using public spaces? If so, what do you think contributed to that experience?

  9. If you could change one thing about how you access your most frequent destination, what would it be?

  10. What improvements would make you feel safer accessing your destinations (e.g., safe crossings,
    improved lighting, slower vehicle speeds, connected sidewalks)?

  11. How do you get information about any changes to transportation? (Fare changes, fare
    enforcement changes, route changes, street closures, construction, etc.)

  12. Is there anything we didn't ask you that you would like to share?


  1. What are the common places you go to? How do you get there?

  2. Can you tell us about your experience getting around the city— especially when using sidewalks and roads?

  3. What kinds of improvements would make you feel safer accessing your destinations?

  4. When you're outside, how do you know if you feel unsafe or uncomfortable?

  5. When you feel unsafe walking to or waiting for the bus, how does that affect what you do— like changing your route, schedule, or not going at all?


Data Collection Goals

Qualitative Data Collection

We aimed to collect 1,000 survey responses and engage 500 participants through focus groups and interviews to gather deeper, qualitative insights.


We partnered with several food banks across Seattle to ensure we were targeting different neighborhoods across Seattle.

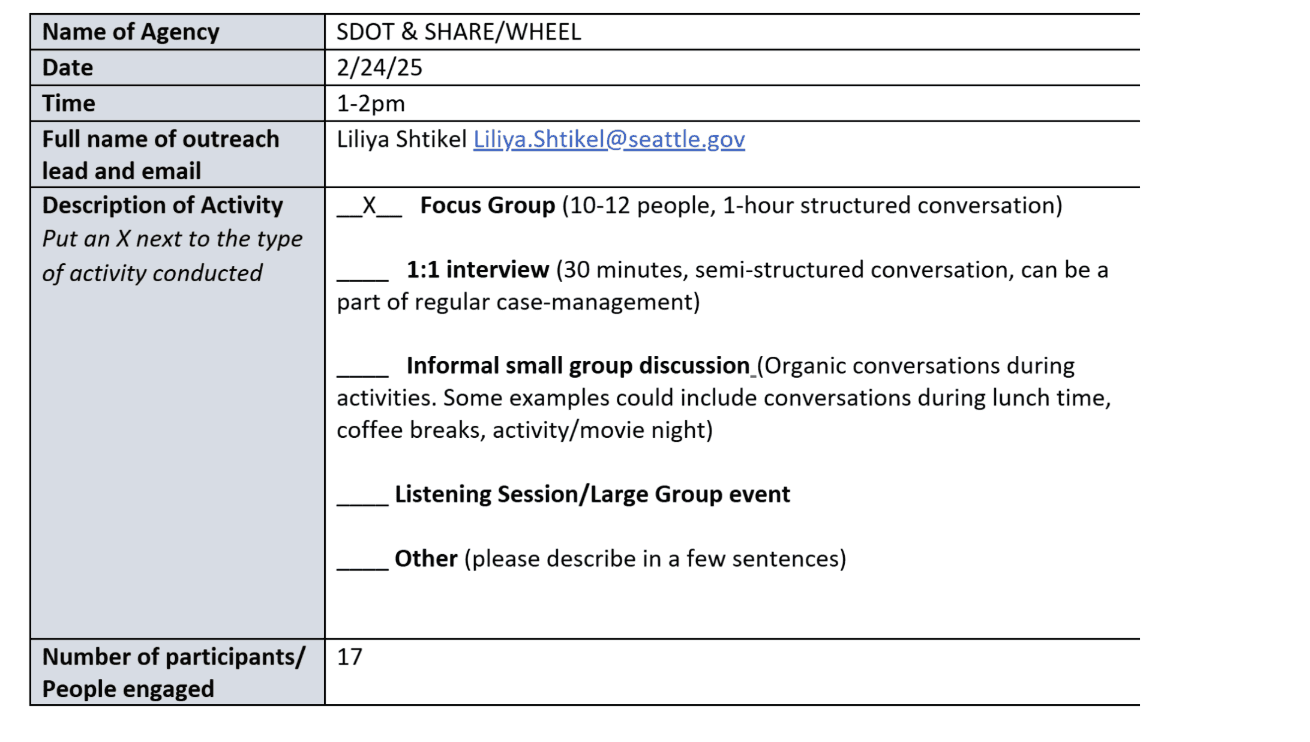
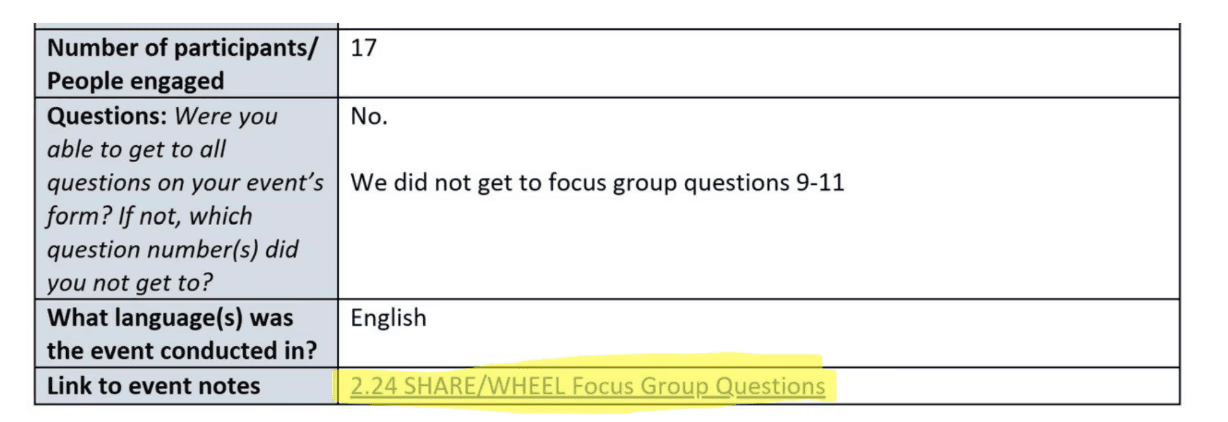
I designed a data collection form for CBO partners to use to report qualitative data from any user interviews, focus groups, and discussions that they hosted.


This form captured details about when the event was conducted, what format was used, how many people were present, raw notes, and key summaries highlighting main takeaways from the event. All partners were asked to send in their notes within 25 days of conducting the research event. This was to ensure that qualitative data was reported in a timely manner.

THE GOAL

THE GOAL

500 responses for qualitative outreach

500 responses for qualitative outreach

1000 survey responses

1000 survey responses

The digital survey was designed on SurveyMonkey and the paper version was designed on Microsoft Word. Survey questions focused more on transit travel patterns, and safety trends across transit infrastructure.


Once the surveys were ready, we piloted them with a group of people through the Seattle Public Library. This pilot event was particularly helpful because it guided us to reword some questions to better focus on the transit safety experience. After several iterations, the surveys were then distributed digitally and on paper.


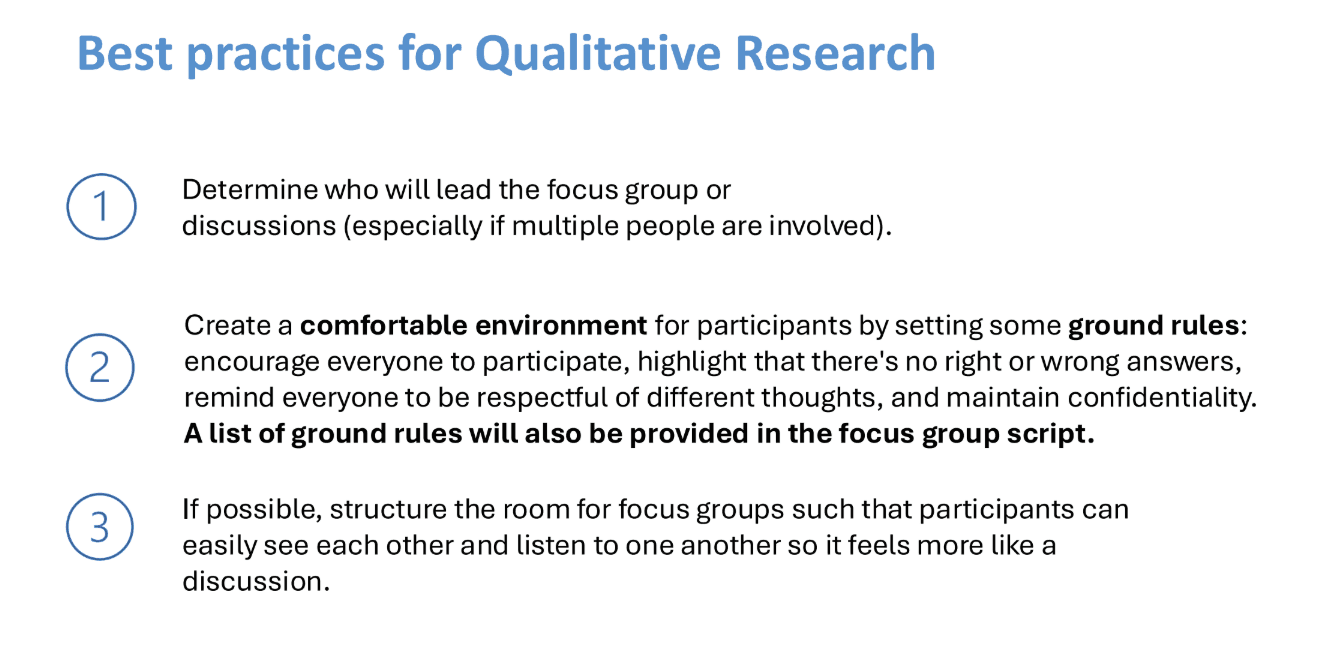
Since our CBO partners were involved so heavily in the research implementation stage, we made sure they had the tools they needed to carry out the research. So, I prepared a research implementation training covering best practices.

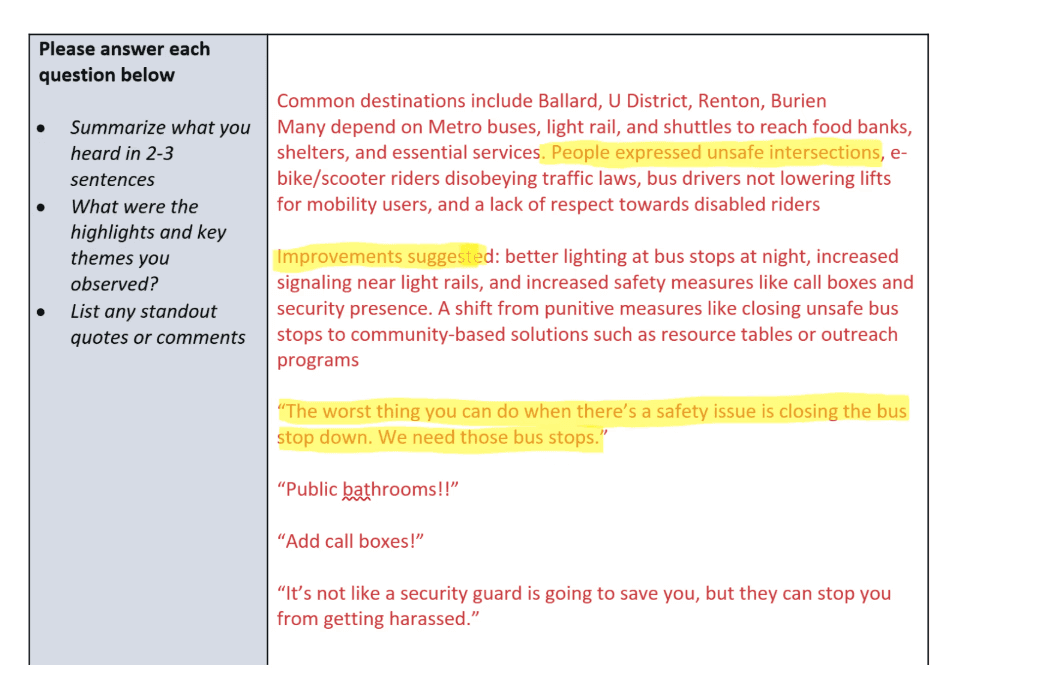
Since this is an ongoing project, we are currently in the process of gathering and analyzing the data using Tableau and Excel to uncover trends across both quantitative and qualitative responses. Our initial insights highlight recurring safety concerns related to pedestrian infrastructure, lighting, and interactions at bus stops. As my team and I continue to synthesize findings, we're working closely with our agency partners to ensure the insights are actionable and grounded in community experiences. Stay tuned for updates as I share deeper findings and recommendations in the coming months!

DATA ANALYSIS & IMPACT

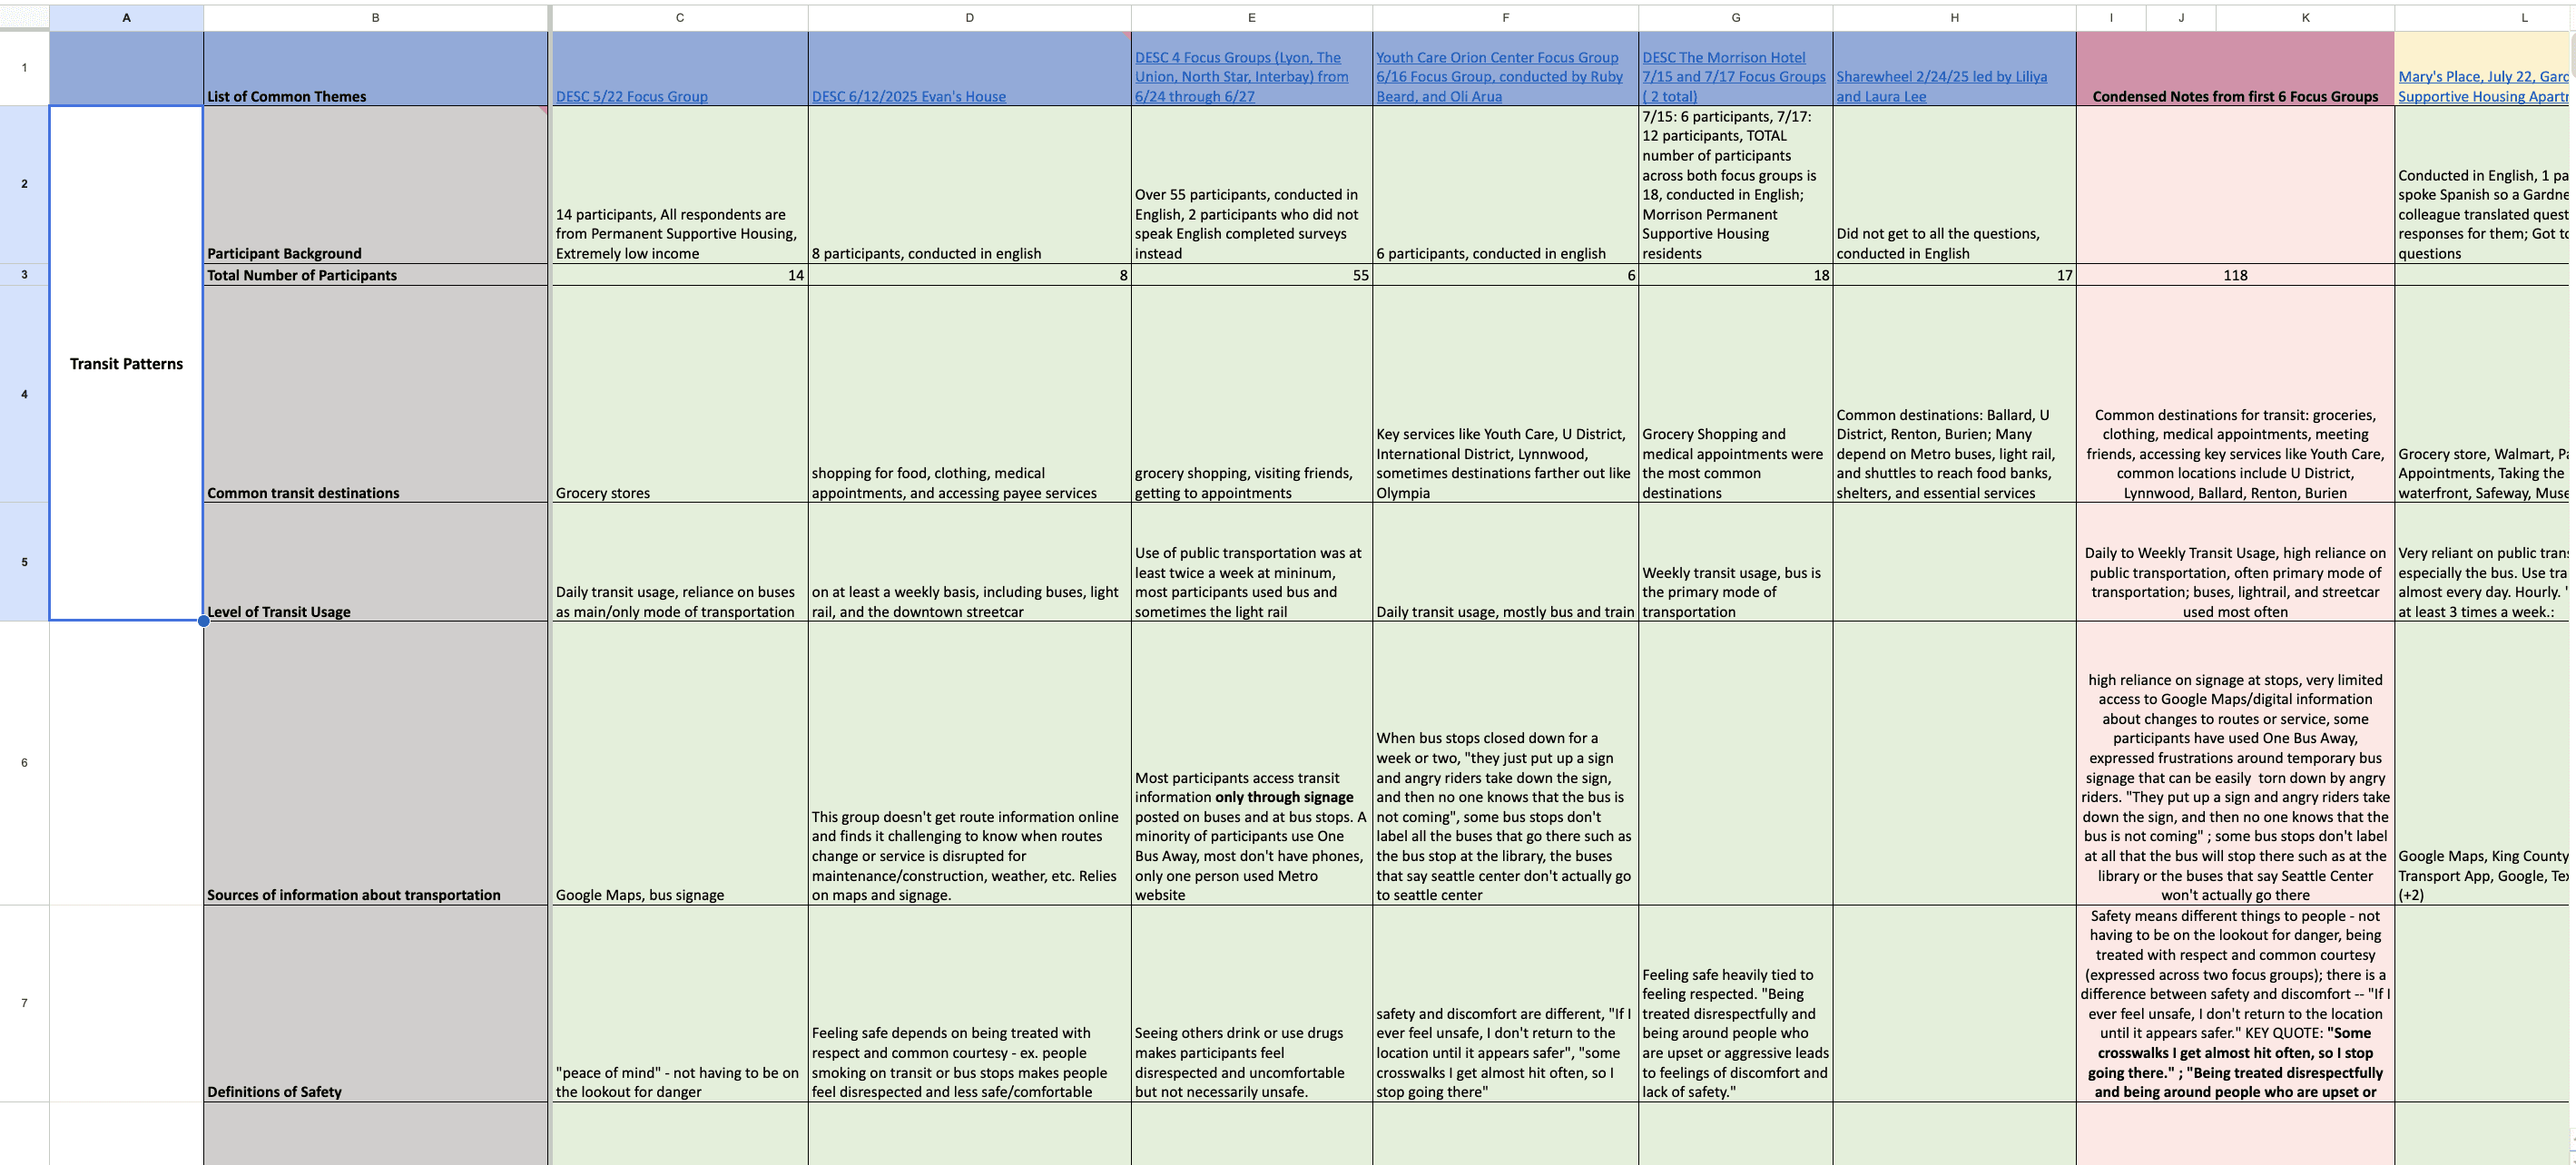
Initial Thematic Analysis of Focus Group Data

Working in partnership with community-based organizations changed how I think about research. Trust, language, and who asks the questions matter just as much as the questions themselves. I saw firsthand that trauma-informed, community-centered research leads to more honest and meaningful insights.

I also learned the value of combining quantitative and qualitative methods. Surveys helped us identify patterns, but interviews revealed the lived experiences behind those patterns. Together, they provided a more complete picture.


REFLECTION

View Other Projects

1:31:37 AM

mishtidhawan@gmail.com currently enjoying a cup of earl grey :D

1:31:37 AM

mishtidhawan@gmail.com currently enjoying a cup of earl grey :D